
A Python NPZD model based on EMPOWER (Anderson et al. 2015 GMD). PyNPZD simulates nutrients, phytoplankton, zooplankton, and detritus in a zero-dimensional ocean mixed layer.
- Python 3.10+
- uv (recommended) or pip
# Clone the repository
git clone https://github.com/ruiying-ocean/PyNPZD.git pynpzd
cd pynpzd

# Install dependencies
uv sync

# Install with development dependencies for testing
uv sync --extra dev# Clone the repository
git clone https://github.com/ruiying-ocean/PyNPZD.git pynpzd
cd pynpzd
# Install dependencies
pip install -e .
# For development
pip install -e ".[dev]"# With uv
uv run pynpzd
# With pip/regular Python
pynpzdThe command runs the config.toml in the current folder and plots the results.
The repository's config.toml uses remote Copernicus forcing (see
Using Remote Forcing Data). To run without
credentials, use a station config such as examples/empower_observations.toml.
See Examples for Python usage.
The core light-limitation kernels are JIT-compiled with Numba on first use for faster integrations, so the initial run may take a little longer while the compiled functions are cached.
Set source = "remote" in the [FORCING] section of config.toml to pull
mixed-layer depth, sea-surface temperature, and irradiance directly from remote
providers. The [FORCING.remote] block specifies the target location, the time
range, and an on-disk cache for the downloaded subsets, while each
[[FORCING.remote.datasets]] table defines either an OPeNDAP URL or a
Copernicus Marine dataset identifier plus the variable to extract and any unit
conversions. When dataset_id is provided the loader calls the Copernicus
Marine Toolbox (copernicusmarine.open_dataset) so you must run
copernicusmarine login (or configure the COPERNICUSMARINE_USERNAME and
COPERNICUSMARINE_PASSWORD environment variables) before the model can access
the data. See tests/test_remote_forcing.py for an end-to-end example that
exercises the loader in both climatology and time-series modes.
Time-series runs require daily forcing samples. Mixed-layer depth is interpolated between successive days; deepening entrains nutrients and dilutes the existing concentrations. The final depth is held constant on the last day.
# With uv
uv run pytest tests/

# With pip/regular Python
python -m pytest tests/
The suite includes comparisons with the original EMPOWER-1.0 R model, using
checked-in reference outputs. R and network access are not needed to run them.
Use uv run pytest tests/ -m "empower and not slow" for the quick reference
checks, or uv run pytest tests/ -m empower to include both five-year simulation
checks. The unfiltered command above runs everything.
See the reference-test guide for coverage, tolerances, and how to regenerate the expected values from the official code.
# Build wheel and source distribution
uv buildThis runs five years at BIOTRANS (47°N, 20°W) with the original EMPOWER-1.0 inputs and the built-in station forcing, so nothing is downloaded:
from pynpzd import NPZDModel

model = NPZDModel("examples/empower_observations.toml")
time, state = model.run()  # time in days; state columns are P, N, Z, D (mmol N m⁻³)

final_year = time >= 4 * 365
print("Year-five peak P, N, Z, D:", state[final_year].max(axis=0).round(2))
model.plot_results(time, state)
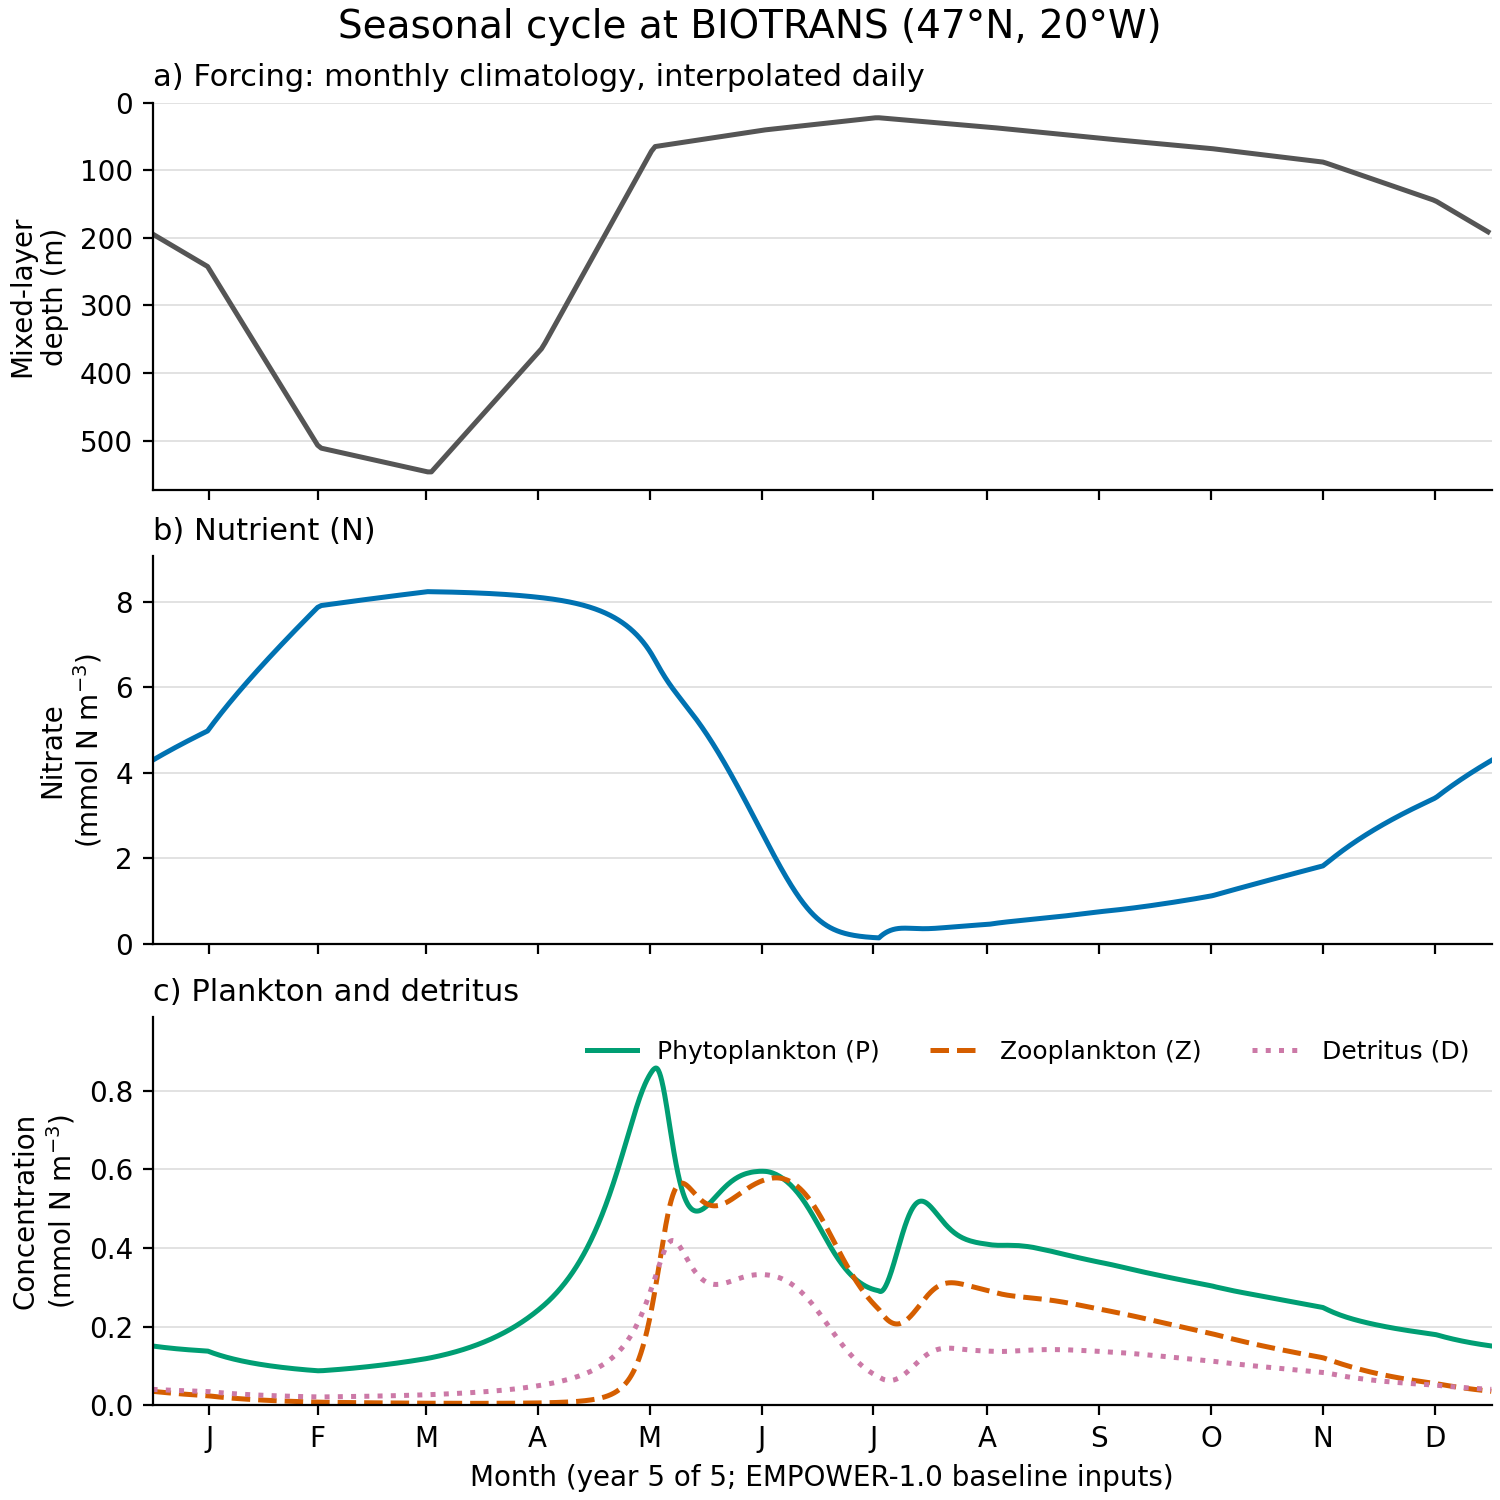
Year five of this run, with the mixed-layer forcing that drives it. Deep winter
mixing supplies nitrate; the spring bloom follows the shoaling mixed layer and
is grazed down by zooplankton. Regenerate it with
uv run --no-sync python examples/plot_station_cycle.py.
Edit settings and params after loading a config, then call
initialize_model() so the station forcing is reloaded:
from pynpzd import NPZDModel

model = NPZDModel("examples/empower_observations.toml")
model.settings["flag_stn"] = 4  # Papa (50°N, 145°W)
model.settings["flag_LI"] = 2   # Evans & Parslow (1985) light limitation
model.params.update(Vp0=1.25, alpha=0.075, Imax=1.25)  # Papa values, Table 3
model.initialize_model()
time, state = model.run()
See Configuration for every station and flag.
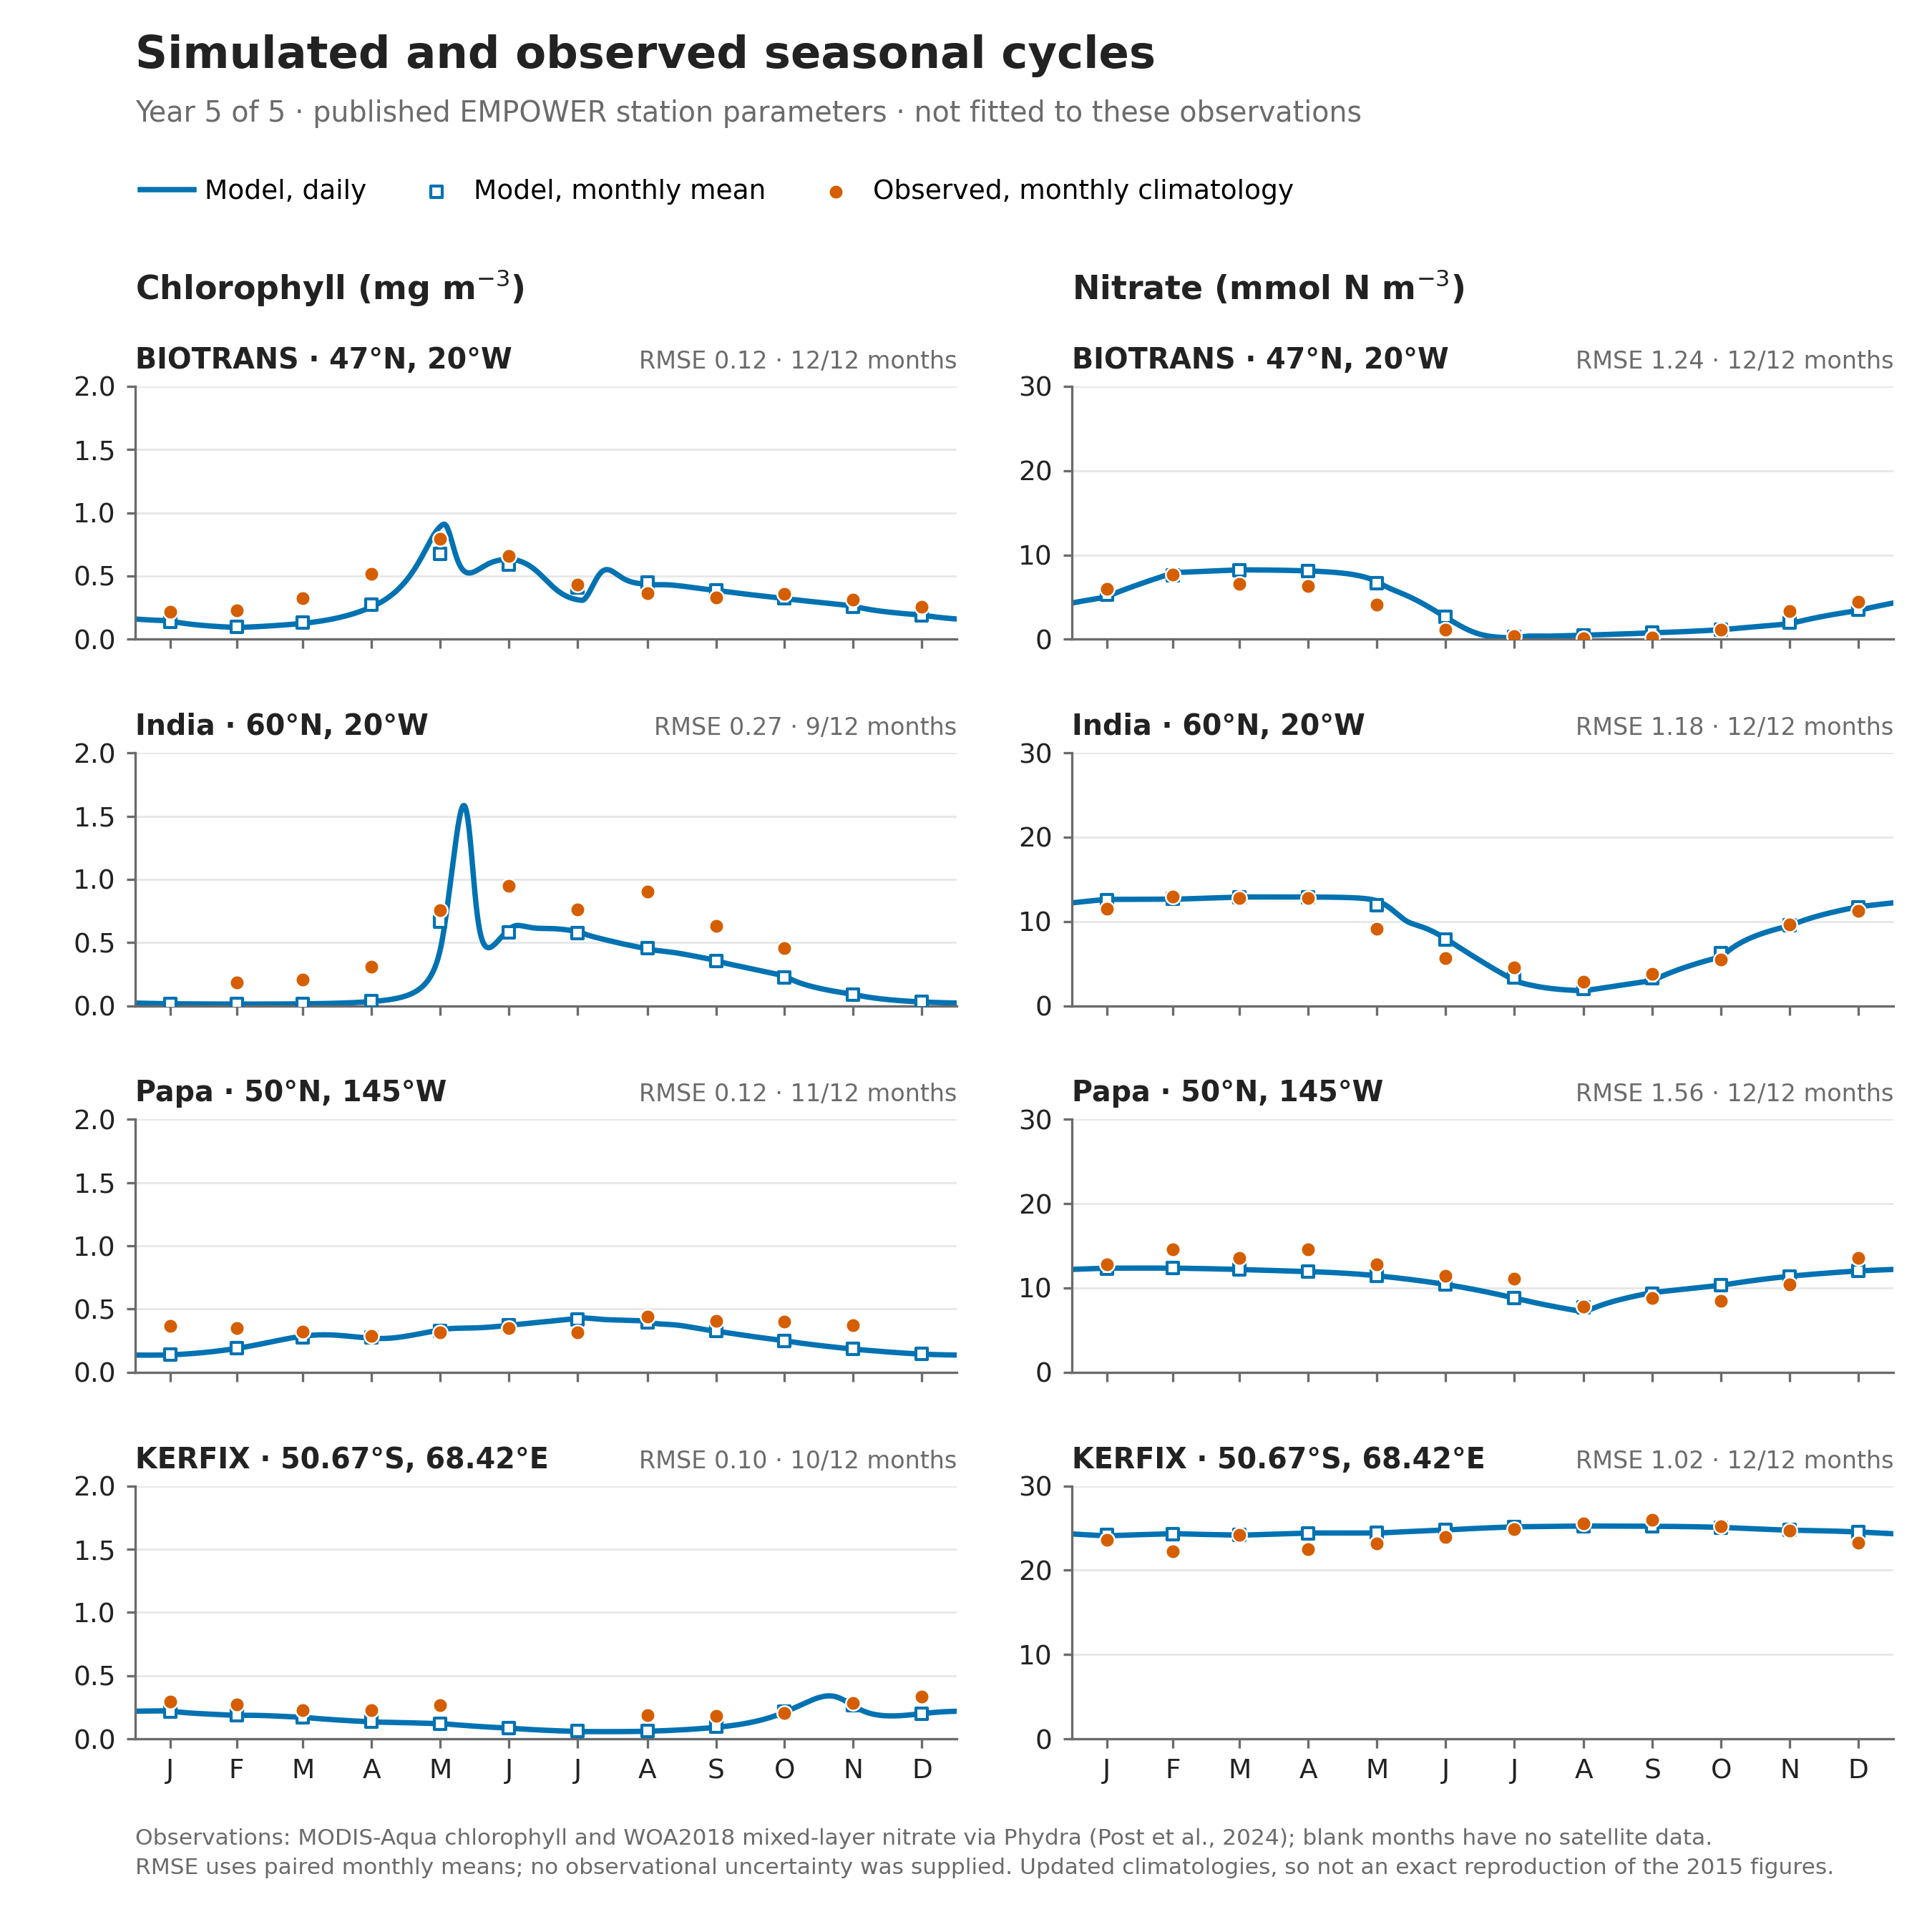
uv run --no-sync python examples/compare_observations.pyThis produces a four-station chlorophyll and nitrate figure using published
monthly observational climatologies. The PNG, PDF, and comparison tables are
saved under data/examples/empower_observations/. See the
example guide for data sources, units, and differences
from the original EMPOWER figures.
- 3 main forcings: SST (T), MLD (Z), irradiance (I0)
- seasonal variation
Z -> N0 (deep-sea nutrient) Z -> light (Beer's law) Integrated photosynthesis rate => needs integration over depth and time
Kpar (light attenuation, Kpar) option1: simple linear function (one layer) option2: polynomial function considering depth
Light limitation (L_I) multi-layer option1: numeric option2: EP85 option3: Anderson93
P-I curve (implemented both for numeric L_I) option1: Smith's function option2: exponential function
The model is configured via config.toml. Key parameters include:
-
delta_t: Saved output interval in hours (use a value that divides 24 evenly). The adaptive solver chooses its own internal steps. The original R model instead uses a fixed integration step in days, so small numerical differences are expected even with matching parameters and forcing. -
flag_stn: Station selection (1-4)- Station 1: India (60°N 20°W)
- Station 2: Biotrans (47°N 20°W)
- Station 3: Kerfix (50°40'S 68°25'E)
- Station 4: Papa (50°N 145°W)
-
flag_LI: Light limitation method- 1: Numeric integration
- 2: Evans & Parslow 1985
- 3: Anderson 1993
-
flag_atten: Light attenuation model- 1: Simple single-layer
- 2: Multi-layer spectral
-
flag_force: Forcing modetrue: Constant chemostat conditionsfalse: Time-varying environmental data
The NPZD model tracks four state variables:
- P: Phytoplankton (mmol N m⁻³)
- N: Nutrients (mmol N m⁻³)
- Z: Zooplankton (mmol N m⁻³)
- D: Detritus (mmol N m⁻³)
pynpzd/                      # Repository
├── pynpzd/                  # Installable package
│   ├── model.py             # Main model class and command
│   ├── npzd_funcs.py        # Mathematical functions
│   ├── forcing.py           # Remote forcing loader
│   └── stations_forcing.txt # Station forcing data
├── config.toml              # Model configuration
├── tests/                   # Test suite
├── pyproject.toml           # Package configuration
Anderson, T. R., Gentleman, W. C., and Yool, A.: EMPOWER-1.0: an Efficient Model of Planktonic ecOsystems WrittEn in R, Geosci. Model Dev., 8, 2231–2262, https://doi.org/10.5194/gmd-8-2231-2015, 2015.