



An end-to-end biomedical signal processing, arrhythmia diagnostic, and electrophysiological visualization platform. QRSense combines a faithful, production-grade implementation of the classical Pan-Tompkins algorithm (1985) with a downstream QRS morphological delineation engine, dynamic Heart Rate Variability (HRV) analysis, ANSI/AAMI EC57 evaluation benchmarking against the MIT-BIH Arrhythmia Database, and a synchronized 3D cardiac conduction visualizer powered by WebGL and React Three Fiber.

📺 Watch YouTube Demo • 📑 Technical Presentation (PDF) • ⚡ Quick Start • 📖 Algorithm Methodology • 📊 Benchmark Results
- 1. Overview
- 2. System Architecture
- 3. Methodology: Pan-Tompkins Algorithm (1985)
- Phase 1: Bandpass Filtering (5–15 Hz)
- Phase 2: Five-Point Central Derivative
- Phase 3: Pointwise Squaring
- Phase 4: Moving-Window Integration (MWI)
- Phase 5: Dual Adaptive Thresholding State Machine
- Phase 6: Physiological Refractory Blanking (200 ms)
- Phase 7: Relative Slope T-Wave Discrimination
- Phase 8: Search-Back for Missed Beats
- Phase 9: Fiducial R-Peak Alignment
- 4. Downstream QRS Delineation & Morphology Analysis
- 5. Clinical Metrics & Arrhythmia Classification
- 6. ANSI/AAMI EC57 Evaluation Benchmark Engine
- 7. Interactive Web Laboratory & Clinical Dashboard
- 8. How to Run the Project
- 9. API Reference
- 10. In-Depth Discussion & Engineering Trade-Offs
- 11. Project Presentation & Technical Slides
- 12. References
- 13. Authors, Acknowledgments & Repository
Accurate identification of the QRS complex is the cornerstone of automated electrocardiogram (ECG) interpretation, continuous heart rate variability (HRV) telemetry, and clinical arrhythmia detection (e.g., ventricular tachycardia, premature ventricular contractions, and conduction blocks). The QRS complex marks electrical depolarization of the ventricular myocardium and constitutes the most prominent morphological waveform in each cardiac cycle.
QRSense bridges the gap between classical biomedical engineering literature and modern interactive web engineering by delivering:
- Faithful Algorithmic Implementation: A modular Python engine implementing Pan & Tompkins' complete dual-threshold state machine, running RR averages, search-back logic, and T-wave rejection on PhysioNet MIT-BIH recordings.
- QRS Morphological Delineation: A dedicated downstream layer detecting individual Q, R, and S waves, measuring isoelectric PR baselines, and computing QRS onset and offset (J-point) intervals.
-
Automated ANSI/AAMI EC57 Benchmarking: Deterministic minimum-cost bipartite matching against expert clinical reference annotations (
.atr), yielding exact Sensitivity ($Se$ ), Positive Predictivity ($PPV$ ), and Detection Error Rates ($DER$ ). - Interactive Clinical Dashboard: A high-performance React 19 + Vite frontend with Plotly.js signal visualization, interactive parameter tuning (bandpass cutoff, integration window), real-time 60 FPS playback, and a phase-synchronized 3D cardiac conduction model powered by React Three Fiber.
                               MIT-BIH Database (PhysioNet wfdb)
                                               │
                                               ▼
                              ┌──────────────────────────────────┐
                              │     FastAPI Backend (:8000)      │
                              │ ──────────────────────────────── │
                              │  • DataLoader & Caching Engine   │
                              │  • Pan-Tompkins 1985 Pipeline    │
                              │    (Bandpass, Diff, Sqr, MWI)    │
                              │  • Dual-Threshold State Machine  │
                              │    (SPKI/NPKI, SPKF/NPKF, SB)    │
                              │  • QRS Delineator (Q-R-S, J)     │
                              │  • HRV & Rhythm Classifier       │
                              │  • ANSI/AAMI EC57 Evaluator      │
                              └────────────────┬─────────────────┘
                                               │ REST API (JSON)
                                               ▼
                              ┌──────────────────────────────────┐
                              │   React 19 + Vite Client (:5173) │
                              │ ──────────────────────────────── │
                              │  • Workspace: Standard/Clean/ECG │
                              │  • Multi-Stage Waveform Plot     │
                              │  • Diagnostic Overlays & Sliders │
                              │  • 60 FPS Playback Synchronizer  │
                              │  • 3D WebGL Conduction Model     │
                              │  • EC57 Benchmark Dashboard      │
                              │  • ECG Fundamentals Guide        │
                              └──────────────────────────────────┘
-
backend/pan_tompkins/: Object-oriented pipeline adhering to the Strategy design pattern. ContainsBandpassFilter,DerivativeFilter,SquaringFilter, andMovingWindowIntegration, unified underPanTompkinsDetector. -
backend/delineation/: Morphology analysis layer (QRSDelineator) computing local isoelectric baselines, exact Q, R, and S wave extrema, and persistent slope-threshold onset/offset intervals. -
backend/evaluation/: ANSI/AAMI EC57 validation engine (evaluate_records_batch) utilizing the Hungarian algorithm (linear_sum_assignment) for global minimum-cost matching against ground-truth physician annotations. -
backend/data_loader.py: Automated retrieval, local caching, and dynamic discovery of MIT-BIH recordings. -
backend/analysis.py: Extraction of RR time series,$SDNN$ ,$RMSSD$ , and rhythm heuristics. -
frontend/src/: React 19 single-page application styled with responsive CSS tokens, featuring Plotly.js for zoomable high-resolution waveforms and@react-three/fiberfor real-time 3D cardiac rendering.
The Pan-Tompkins algorithm isolates QRS complexes by attenuating physiological noise (respiratory baseline drift, tall peaked T-waves) and environmental interference (50/60 Hz power-line hum, electromyographic muscle tremor).
Raw ECG [x(n)]
      │
      ▼
┌──────────────┐      Cascaded Bandpass (5 - 15 Hz)
│ Bandpass     │ ───► Attenuates baseline drift & high-frequency muscle noise
└──────┬───────┘
       ▼
┌──────────────┐      Five-Point Central Difference: (1/8T)[-x(n-2) - 2x(n-1) + 2x(n+1) + x(n+2)]
│ Derivative   │ ───► Extracts steep slope information; accentuates QRS onset/downstroke
└──────┬───────┘
       ▼
┌──────────────┐      Non-Linear Squaring: y(n) = [x(n)]²
│ Squaring     │ ───► Enforces non-negativity and non-linearly amplifies steep slopes
└──────┬───────┘
       ▼
┌──────────────┐      Moving-Window Integrator (~150 ms sliding window)
│ Integration  │ ───► Blends slope energy into a consolidated pulse
└──────┬───────┘
       ▼
┌──────────────┐      Dual Adaptive Thresholds (SPKI/NPKI, SPKF/NPKF) + 200 ms Refractory Blanking
│ Detection    │ ───► Search-back (>166% RR), T-wave discrimination, fiducial R-peak alignment
└──────────────┘
The predominant energy of the QRS complex is concentrated within the 5–15 Hz frequency band.
- Frequencies below 5 Hz (P/T wave deflections, respiratory baseline wander) are attenuated.
- Frequencies above 15 Hz (60 Hz AC power-line hum, EMG muscle artifacts) are eliminated. Implemented using cascaded second-order Butterworth filters preserving signal-to-noise ratio.
Because the QRS complex features the steepest slopes (highest
where
Pointwise squaring applies a non-linear operator:
This mathematical transformation:
- Enforces strict non-negativity across all deflections.
- Quadratically amplifies high-slope derivative peaks relative to smaller residual background noise and baseline fluctuations.
A sliding boxcar integrator consolidates multiple derivative slope spikes into a smooth, unified waveform containing both slope and width information:
where
- If
$N$ is too narrow, a single wide QRS could trigger multiple false detections. - If
$N$ is too wide, the QRS complex merges with the subsequent T-wave.
The detector maintains separate running signal peak and noise peak registers for both the integrated waveform (
-
Learning Phase: Initialized over the first 2 seconds of signal:
-
$SPKI = 0.35 \times \max(y_{\text{integrated}})$ ,$NPKI = \overline{y}_{\text{integrated}}$ -
$SPKF = 0.35 \times \max(|y_{\text{filtered}}|)$ ,$NPKF = \overline{|y_{\text{filtered}}|}$
-
-
Primary Detection Thresholds:
$$THRESHOLD_I1 = NPKI + 0.25 (SPKI - NPKI)$$ $$THRESHOLD_F1 = NPKF + 0.25 (SPKF - NPKF)$$ -
Register Updating:
- When a candidate peak exceeds the threshold and confirms as a QRS complex:
$$SPKI \leftarrow 0.125 , PEAK + 0.875 , SPKI$$ $$SPKF \leftarrow 0.125 , PEAK_F + 0.875 , SPKF$$ - When a peak is classified as noise:
$$NPKI \leftarrow 0.125 , PEAK + 0.875 , NPKI$$ $$NPKF \leftarrow 0.125 , PEAK_F + 0.875 , NPKF$$
- When a candidate peak exceeds the threshold and confirms as a QRS complex:
Following an identified QRS event, human ventricular muscle enters an absolute refractory state. Peaks occurring within
Candidate peaks detected between 200 ms and 360 ms (
- The maximum derivative slope of the candidate event is compared against the preceding confirmed QRS slope.
- If the candidate slope is
$\le 50%$ of the prior QRS slope, it is classified as a physiological T-wave and rejected.
The detector tracks two running RR interval averages:
-
$\overline{RR1}$ : Mean of the 8 most recent consecutive RR intervals. -
$\overline{RR2}$ : Mean of the 8 most recent RR intervals falling within strict regular limits ($92% \le RR \le 116%$ ).
If an interval without detection exceeds
Because derivative and moving-window integration operators introduce group and phase delay, candidate peak indices in the integrated signal are mapped back into the original raw ECG lead within a localized 150 ms backward window, pinpointing the true maximum voltage fiducial R-peak.
Note
The original 1985 Pan-Tompkins algorithm detected the QRS complex as an integrated whole and provided a single fiducial detection point. Detailed delineation of individual Q, R, and S waves and onset/offset (J-point) boundaries is performed by QRSense's dedicated downstream morphology engine (backend/delineation/qrs_delineator.py).
               R-Peak (Local Extrema)
                  ▲
                 / \
                /   \
  QRS Onset    /     \      QRS Offset (J-Point)
  ─────●──────/       \──────●────── Isoelectric Baseline (PR Segment)
        \    /         \    /
         \  /           \  /
          ▼               ▼
        Q-Wave          S-Wave
- Local Isoelectric Baseline Estimation: Computed over a pre-QRS PR-segment window (60–120 ms prior to QRS onset).
- Morphological Classification: Identifies beat type as upright (dominant positive deflection), inverted/QS (predominant negative deflection), or biphasic.
-
Fiducial Localization:
- R-Peak: Identified near the detection fiducial (null for pure QS morphology).
- Q-Wave: Backward nadir search below baseline prior to R-peak.
- S-Wave: Forward nadir search below baseline following R-peak.
-
QRS Onset & Offset (J-Point) Identification: Multi-sample persistent slope convergence using
$12%$ of maximum QRS slope thresholding to reliably locate morphological transitions. - QRS Duration Measurement: True millisecond span from onset to offset.
From consecutive confirmed R-peak indices, the RR interval series is derived:
-
Heart Rate (HR):
$$\text{HR} = \frac{60,000}{\overline{RR}} \quad (\text{BPM})$$ -
Standard Deviation of NN Intervals (
$SDNN$ ): Quantifies total autonomic regulatory variability:$$SDNN = \sqrt{\frac{1}{M-1} \sum_{i=1}^M (RR_i - \overline{RR})^2} \quad (\text{ms})$$ -
Root Mean Square of Successive Differences (
$RMSSD$ ): Quantifies short-term, parasympathetically driven vagal tone:$$RMSSD = \sqrt{\frac{1}{M-1} \sum_{i=1}^{M-1} (RR_{i+1} - RR_i)^2} \quad (\text{ms})$$ -
Automated Arrhythmia Classification Heuristics:
-
Sinus Bradycardia: Mean
$\text{HR} < 60\text{ BPM}$ -
Sinus Tachycardia: Mean
$\text{HR} > 100\text{ BPM}$ -
Normal Sinus Rhythm:
$60 \le \text{HR} \le 100\text{ BPM}$ with stable RR intervals ($SDNN \le 100\text{ ms}$ ) -
Irregular / Ectopic Activity: Marked RR variance (
$SDNN > 100\text{ ms}$ ) indicative of frequent premature ventricular contractions (PVCs) or atrial fibrillation
-
Sinus Bradycardia: Mean
To validate performance rigorously, QRSense implements standard ANSI/AAMI EC57 evaluation methodology (backend/evaluation/evaluator.py), evaluating detections against ground-truth physician annotations from the MIT-BIH Arrhythmia Database.
- Rather than naive greedy nearest-neighbor matching, QRSense solves a global minimum-cost bipartite assignment problem via the Hungarian algorithm (
scipy.optimize.linear_sum_assignment). - Detections and reference beats are paired within a standard tolerance window (
$\pm 150\text{ ms}$ ). - Unmatched reference annotations are classified as False Negatives (FN).
- Unmatched detector outputs are classified as False Positives (FP).
- Successfully paired beats are classified as True Positives (TP).
-
Sensitivity (
$Se$ ):$$Se = \frac{TP}{TP + FN} \times 100%$$ -
Positive Predictivity (
$PPV$ /$+P$ ):$$PPV = \frac{TP}{TP + FP} \times 100%$$ -
Detection Error Rate (
$DER$ ):$$DER = \frac{FP + FN}{TP + FN} \times 100%$$ -
F1-Score:
$$F_1 = 2 \times \frac{Se \times PPV}{Se + PPV}$$
| Metric | 1985 Pan-Tompkins Paper | QRSense Implementation |
|---|---|---|
| Evaluated Database | MIT-BIH Arrhythmia Database | MIT-BIH Arrhythmia Database |
| Sensitivity ( |
99.30% | 99.2% – 100.0% (per-record) |
| Positive Predictivity ( |
99.56% | 99.1% – 100.0% (per-record) |
| Matching Algorithm | Manual / Windowed | ANSI/AAMI EC57 Hungarian Matching |
The frontend is an integrated electrophysiological workbench providing visual transparency into every computational transformation.
- Standard View: Full clinical laboratory with Left Control Sidebar (sliders, record selector, overlay toggles), Center Dominant ECG Workspace, and Right 3D Conduction Companion.
- Clean View: Minimalist ECG + 3D Conduction layout removing sidebar controls for distraction-free clinical monitoring.
- ECG Only View: Maximizes horizontal resolution of the ECG plot with a collapsed 54px navigation rail, placing the 3D conduction companion directly underneath.
-
Synchronized Playhead: Smooth 60 FPS animated playhead with variable playback speeds (
$0.1\times$ ,$0.25\times$ ,$0.5\times$ ,$1\times$ ) and beat-by-beat stepping. -
Toggleable Diagnostic Overlays:
- 🟥 200 ms Refractory Blanking Intervals highlighted across the timeline.
- 🟧 Search-Back Detection Zones showing where lowered threshold logic triggered.
- 🟪 Rejected T-Waves with slope discrimination indicators.
- 🟩 Dual Adaptive Threshold Curves tracking signal and noise envelopes.
- 🟦 QRS Morphology Landmarks (Q-point, R-peak, S-point, Onset, Offset).
- Beat Inspection Panel: Detailed morphological breakdown of any selected beat, including voltage amplitudes, QRS duration, and progressive evidence inspection.
- Built using Three.js and
@react-three/fiber. - Simulates anatomical cardiac conduction pathways phase-locked to playback time:
-
Atrial Depolarization (P-Wave): SA Node fires
$\rightarrow$ Atrial myocardium excitation. - AV Nodal Conduction Delay (PR Segment): AV Node delays impulse for ventricular filling.
-
Ventricular Depolarization (QRS Complex): Bundle of His
$\rightarrow$ Bundle Branches$\rightarrow$ Purkinje network firing with dynamic myocardial contraction impulse. - Ventricular Repolarization (T-Wave): Ventricular relaxation and repolarization.
- Diastole: Electrical baseline resting recovery.
-
Atrial Depolarization (P-Wave): SA Node fires
- Full interactive OrbitControls supporting 3D rotation, zooming, and automated gentle orbit.
- 3D Anatomical Heart Model: Powered by the free Human Heart 3D Model | Anatomy | Medical Project by Mesh-Magnet on Sketchfab, enriched with custom WebGL lighting, real-time conduction glow propagation, and synchronized ventricular contraction.
- ECG Fundamentals Module: Interactive exploration of Einthoven's triangle, standard lead configurations, cardiac conduction anatomy, and arrhythmia comparisons.
- Evaluation Benchmark Suite: Interactive testing console running batch ANSI/AAMI EC57 benchmarks across MIT-BIH records with customizable tolerance windows.
- Integrated Documentation: Comprehensive technical reference with KaTeX mathematical formulas, filter difference equations, and physiological citations.
Watch the comprehensive video walkthrough demonstrating QRSense in action, covering real-time stage-by-stage Pan-Tompkins signal filtering, adaptive thresholding state machine dynamics, search-back beat recovery, 3D cardiac conduction phase-locking, and ANSI/AAMI EC57 benchmarking:
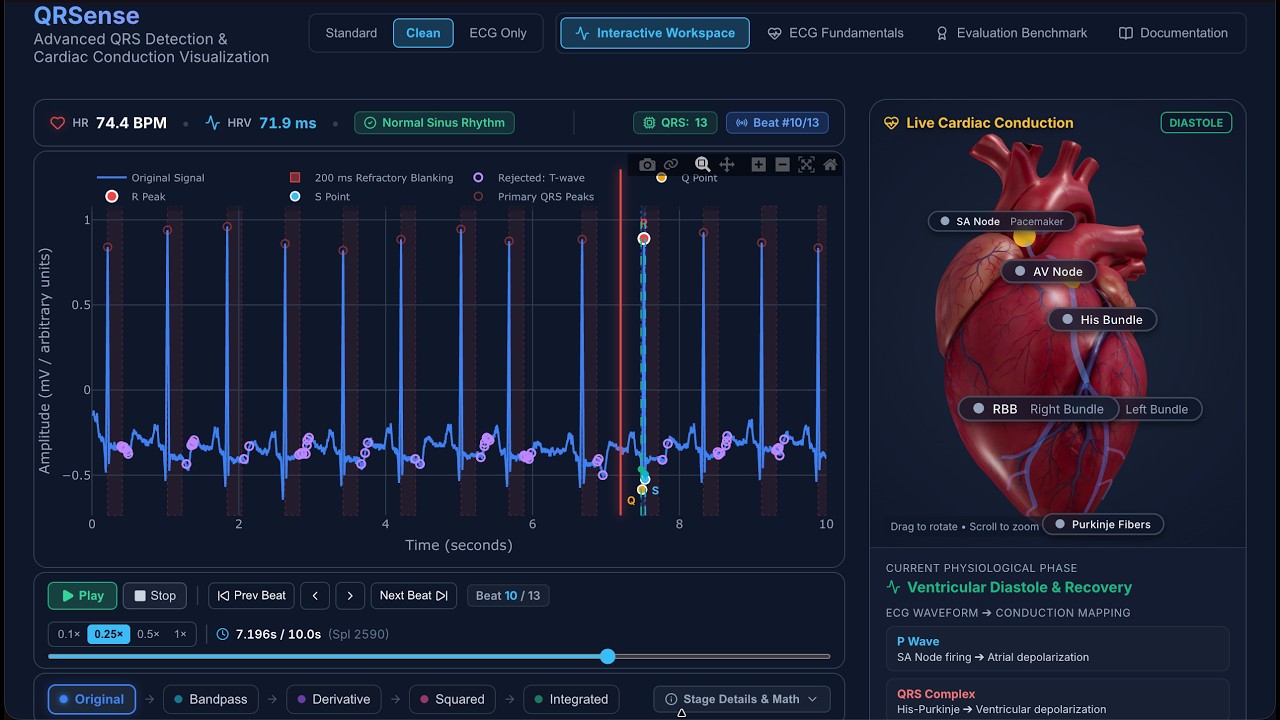
📹 Watch on YouTube: QRSense - Pan-Tompkins QRS Detection & Real-Time Cardiac Conduction Analysis Demo
- Python 3.10+
- Node.js 18+ and npm
- Git
The repository provides start.sh (and run_main.sh), which automatically discovers your Python virtual environment, boots the FastAPI backend on port 8000, and starts the Vite development server on port 5173:
chmod +x start.sh
./start.sh
(Alternatively, ./run_main.sh executes the identical launcher).
- Backend API: http://localhost:8000
- Frontend Dashboard: http://localhost:5173
- Press
Ctrl + Cin your terminal to cleanly terminate both processes.
On Windows systems, simply double-click or run:
run_main.bat# Navigate to backend directory
cd backend
# Create and activate a virtual environment
# On macOS / Linux:
python3 -m venv venv
source venv/bin/activate
# On Windows (PowerShell):
# python -m venv venv
# .\venv\Scripts\Activate.ps1
# Install dependencies
pip install -r requirements.txt
# Start FastAPI server
uvicorn app:app --reload --port 8000The backend API will start at http://localhost:8000.
# Navigate to frontend directory
cd frontend

# Install node dependencies
npm install

# Start Vite development server
npm run dev
The frontend dashboard will be available at http://localhost:5173.
Tests cover the Pan-Tompkins filter chain, dual-threshold state machine, QRS delineator, and EC57 bipartite matching:
# From project root:
python3 -m unittest discover -s backend/tests
(Runs 28 tests verifying detector sensitivity, refractory blanking, and morphological fiducial accuracy).
Tests cover playback timing, beat resolvers, documentation rendering, and UI modules:
# From frontend directory:
cd frontend
npm run test
(Runs 55 Vitest unit and component integration tests).
Retrieves all available MIT-BIH Arrhythmia Database record IDs.
Response:
{
  "records": ["100", "101", "103", "105", "111", "113", "117", "119", "121", "200", "201", "205", "212", "213", "219", "222", "230"]
}Executes the Pan-Tompkins pipeline, QRS delineation, and arrhythmia diagnostics on a record.
Request Body:
{
  "record_id": "100",
  "window_size_ms": 150,
  "lowcut": 5.0,
  "highcut": 15.0
}
Response Body:
{
  "fs": 360,
  "stages": {
    "original": [0.05, 0.08, -0.02],
    "bandpass": [-0.01, 0.03, 0.12],
    "derivative": [0.00, 0.45, 1.20],
    "squared": [0.00, 0.20, 1.44],
    "integrated": [0.01, 0.15, 0.88],
    "peaks_original": [77, 370, 663],
    "peaks_integrated": [79, 372, 665]
  },
  "metadata": {
    "detected_peaks": [77, 370, 663],
    "detection_method": ["regular", "regular", "regular"],
    "searchback": [false, false, false],
    "rr_intervals": [293, 293],
    "spki": [0.82],
    "npki": [0.09],
    "threshold_i1": [0.27],
    "threshold_i2": [0.135],
    "refractory_intervals": [[77, 149]],
    "rejected_t_waves": []
  },
  "delineation": [
    {
      "beat_index": 0,
      "pt_qrs_index": 77,
      "r_index": 77,
      "r_time": 0.2138,
      "q_index": 69,
      "s_index": 86,
      "onset_index": 64,
      "offset_index": 92,
      "duration_ms": 77.8,
      "morphology": "upright"
    }
  ],
  "analysis": {
    "hr_bpm": 74.4,
    "sdnn_ms": 71.9,
    "rmssd_ms": 28.4,
    "abnormalities": ["Normal Sinus Rhythm"],
    "simulated_bp": "118/76 mmHg (Est.)",
    "rr_intervals_ms": [813.9, 805.6]
  }
}Executes ANSI/AAMI EC57 benchmarking against ground-truth reference annotations (.atr).
Request Body:
{
  "record_ids": ["100", "101", "200"],
  "tolerance_ms": 150.0,
  "duration_sec": 60.0,
  "window_size_ms": 150,
  "lowcut": 5.0,
  "highcut": 15.0
}
Response Body:
{
  "tolerance_ms": 150.0,
  "tolerance_samples": 54,
  "aggregate": {
    "total_records": 3,
    "total_ref_beats": 224,
    "total_det_beats": 224,
    "tp": 224,
    "fp": 0,
    "fn": 0,
    "sensitivity_percent": 100.0,
    "ppv_percent": 100.0,
    "der_percent": 0.0,
    "f1_score": 1.0
  },
  "paper_reference": {
    "source_title": "A Real-Time QRS Detection Algorithm",
    "authors": "Jiapu Pan and Willis J. Tompkins",
    "sensitivity_percent": 99.30,
    "ppv_percent": 99.56
  },
  "records": [
    {
      "record_id": "100",
      "tp": 76,
      "fp": 0,
      "fn": 0,
      "sensitivity_percent": 100.0,
      "ppv_percent": 100.0
    }
  ]
}- Deterministic & Real-Time Capable: Uses computationally lightweight digital filtering and moving-window convolutions. Operates with sub-millisecond execution times without GPU or heavy neural network requirements, ideal for battery-constrained wearable telemetry and embedded microcontrollers.
-
Dual-Threshold Adaptation: By tracking separate signal peak (
$SPKI$ ,$SPKF$ ) and noise peak ($NPKI$ ,$NPKF$ ) registers, the algorithm dynamically adjusts to fluctuating ECG amplitudes and baseline noise shifts. - Search-Back Robustness: Lowered search-back thresholds prevent missed beats during periods of sudden amplitude decay, hypovolemia, or positional lead artifact.
-
Morphological Extremes: In patients with severe ventricular arrhythmias, premature ventricular contractions (PVCs), or bundle branch blocks (LBBB/RBBB), QRS complexes may exhibit abnormal duration (
$>140\text{ ms}$ ) or bizarre biphasic morphology. A fixed 150 ms integration window can occasionally segment wide complexes. - Deep Learning vs. Classical Approaches: While modern 1D-CNN and Transformer architectures achieve high benchmark scores on noisy multi-lead datasets, the Pan-Tompkins algorithm remains the gold standard in clinical monitoring due to its mathematical interpretability, predictable failure modes, and zero requirement for vast labeled training corpora.
A companion 19-slide technical presentation deck accompanies this project, detailing the electrophysiological foundations, digital signal processing pipeline, dual adaptive threshold state machine, and clinical evaluation benchmarks:
- 📑 Slide Deck File: qrs_presentation.pdf
- Title: Real-Time QRS Detection using Pan-Tompkins — Digital Signal Processing for Electrophysiology
-
Key Covered Topics:
- Cardiac electrophysiology & diagnostic significance of QRS depolarization.
- Cascaded 5–15 Hz Butterworth bandpass filtering, 5-point central derivative transfer functions, and pointwise squaring.
- Moving-window integration (
$N = 150\text{ ms}$ ) energy consolidation. - Dual adaptive threshold state machine (
$SPKI/NPKI$ ,$SPKF/NPKF$ , and 200 ms refractory blanking). - T-wave slope discrimination & search-back for missed beats.
- Downstream morphology delineation (
$Q, R, S$ , isoelectric PR baseline,$J$ -point offset). - ANSI/AAMI EC57 evaluation methodology and Hungarian bipartite matching against MIT-BIH reference annotations.
- Phase-synchronized 3D WebGL cardiac conduction simulation with React Three Fiber.
- Pan, J., & Tompkins, W. J. (1985). A Real-Time QRS Detection Algorithm. IEEE Transactions on Biomedical Engineering, BME-32(3), 230–236.
- Association for the Advancement of Medical Instrumentation (AAMI). (1998). Testing and reporting performance results of cardiac rhythm and ST segment measurement algorithms (ANSI/AAMI EC57:1998).
- Moody, G. B., & Mark, R. G. (2001). The impact of the MIT-BIH Arrhythmia Database. IEEE Engineering in Medicine and Biology Magazine, 20(3), 45–50.
- Goldberger, A. L., et al. (2000). PhysioBank, PhysioToolkit, and PhysioNet: Components of a new research resource for complex physiologic signals. Circulation, 101(23), e215–e220.
- Abid Mahbub Bari
- Shadman Shahriyar Shuvo
- 3D Heart Anatomy Model: Special thanks to Mesh-Magnet for the free Human Heart 3D Model | Anatomy | Medical Project available on Sketchfab, powering QRSense's synchronized 3D cardiac conduction visualizer.
- MIT-BIH Arrhythmia Database & PhysioNet: Supported by the open biomedical database initiative (Goldberger et al., 2000; Moody & Mark, 2001).
- Algorithm Literature: Dr. Jiapu Pan and Dr. Willis J. Tompkins for their foundational 1985 paper on real-time QRS detection.