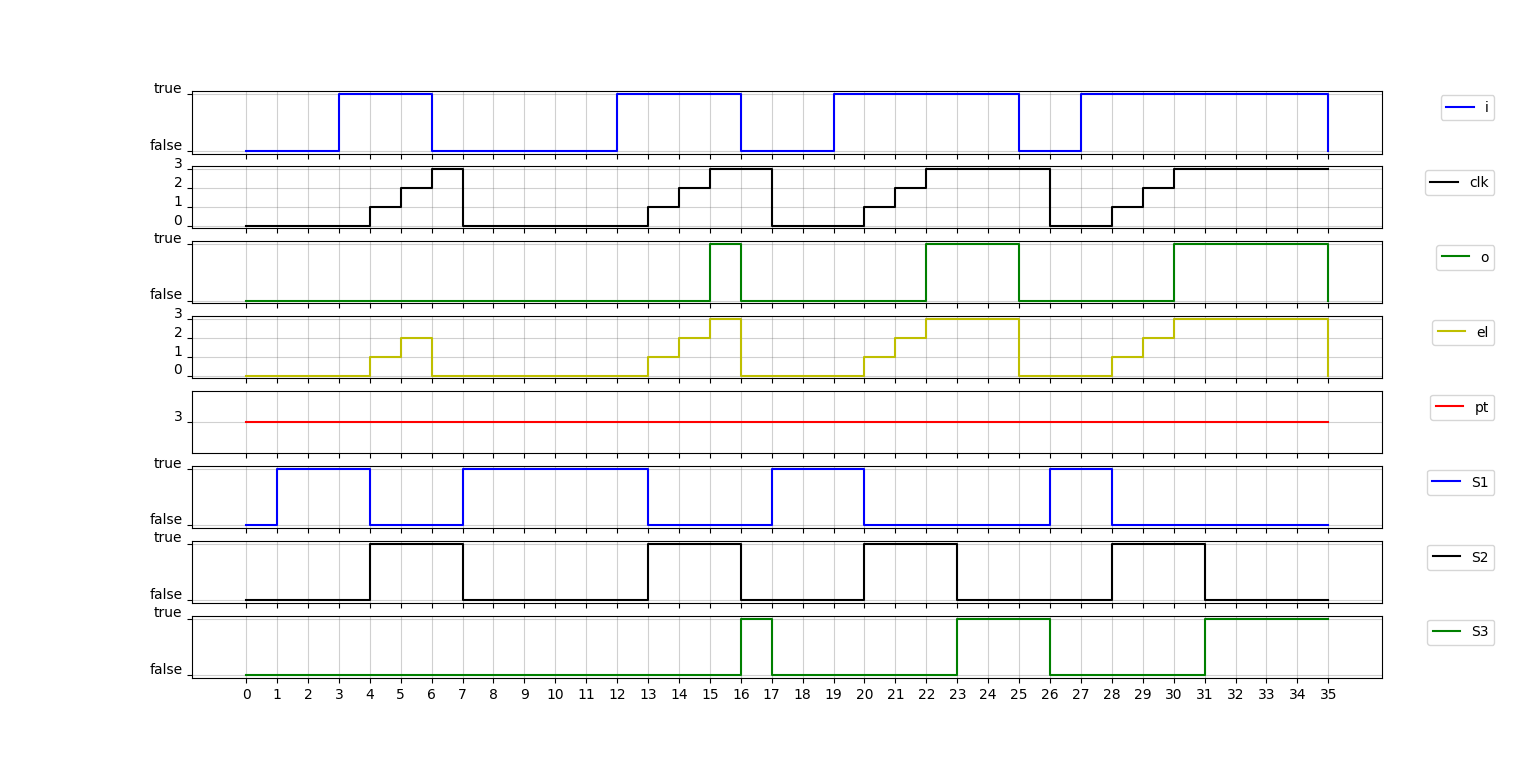
trace2plot is a small set of scripts to visualize traces of Quartz programs simulated with the Averest framework.
- visualization of the traces (*.txt)
- show / hide individual variables
- zoom globally on all charts
- multiple simulation drivers in different figures
- result of example 'trace.txt'